
Title: Astro All Asia Network Financial Statement Analysis
Category: Coursework
Sub Category: Financial Statement Analysis
Subject: Financial Management
References: APA
Astro Annual Report Analysis
ABSTRACT:
Financial statement analyses ASTRO’s Malaysian broadcasting company has been conducted using their annual report of 2012-13. Report starts with the brief outline of the company’s history and then how they have segmented the market, and how ASTRO has strategized their organization. Report provides brief introduction of Astro strategic business units, their organization structure, chairman’s message and analysis conducted by third party on Astro Stock. All these information are provided in the Part-A of the ISU report below.
The main exploration of this assignment is analyzing its finances, vertically, horizontally and using “Ratio-analysis” to allow us to interpret the data and observe how ASTRO is fairing in the industry.
Other than horizontally assessing their firm, this report also uses trend analysis and ratio analysis to asses various different parts of ASTRO. The financial ratio indicates its current liquidity posture, debt equity state, and cash efficiency ratios. These are later interpreted in simpler words for explanatory purposes. All these information can be found in the Part-B and onwards. Financial year 2012 has not been an impressive year for Astro despite having massive increase in the total revenue; however expenses have increased a lot. Company in this financing year is relying more on debt financing instead of equity.
This report also states recommendations for ASTRO to improvise on their stature and provides a conclusion to sum up the entire report.

PART A – FIRST REVIEW OF THE ANNUAL REPORT
1.1 Introduction and Organizational Background:
After the independence of Malaysia TV Broadcasting services started after six years in 1963 by Public Broadcasting service Malaysia which for governed by national government of Malaysia and consists of three TV channels which provide news and entertainment programs for domestic television subscribers. In late nineties in 1995, there was a first Private TV known as Mega TV was introduced which ended up as a failure and was trembled by financial loses and decided to close their operations in less than one year. Astro was second private TV and broadcasting company introduced in 1996, emerged as a Malaysian Brand, given exclusive license as direct-to-home satellite provider until 2017, to dominate position in the booming pay-TV business. Astro is a sole proprietor of pay-tv industry in Malaysia. They are monopolizing the Malaysia’s pay-tv market. The market growth of Astro in Malaysia is probable and stable. By the advent of core development in Internet technology and modern digital broadcasting era, Astro adapted its vulnerability to change and emerged as the largest Broadcasting service provider in Malaysia. The developments in the TV broadcasting in Malaysia recently can be proved that we are ready to moving into more mature markets and changing their trends. They are the leading cross-media operator with direct-to-home satellite television services in Malaysia, Brunei and Indonesia. Back in 2009 Astro has introduced its Astro B.yond, which multi phased innovative service by introducing first state of art High Definition TV service in Malaysia. According to the annual report 2009-10 Astro has more than 2.9 Million Subscribers with the growth rate of 600K new subscriber’s per annum on average. (Annual Report 2013) Address of ASTRO Head Office is located in All Asia Broadcast Centre, Lebuhraya Puchong-Sg. Besi, Bukit Jalil, Technology Park Malaysia, 57000, Kuala Lumpur, Malaysia. Their official website is www.astro.com.my . ASTRO Annual Report shows that financial statement of past three years trends year 2010, 2011 and 2012.
1.2 Strategic Business Units:
Astro has three strategic business units- Television, Radio and Library Licensing and Distribution. Astro Television is the core SBU of Astro All Asia group because more than 90% of revenue is gathered from Television broadcasting business.
Astro Television is one of the SBU of Astro All Asia Networks plc. It provides variety of channels from local, regional and international programming to the Malaysians. The subscribers can easier access to the multi-channel television services for 24 hours a day, a wide range. A wide range of programs offered by Astro are movies, dramas, variety shows, local and international news, documentaries and also educational programs. Astro understands the consumer needs and offers several packages to customers. Astro Television channel are strongly based on the usage of satellite, which is another main users to Malaysia’s Satellite consists of MEASAT-1, MEASAT-2 and MEASAT-3. The way of receiving of Astro channels are using satellite transmission to the receiving dish and decoded via the decoder provided by Astro.

[ Get Superior Financial Statement Analysis Assignment Help From Expert Writers & Boost Your Grades ]
1.3 ALL ASTRO ASIA GROUP:
The below figure shows the organization structure of ASTRO ALL ASIA NETWORK.

1.4 AUDIT COMMITTEE COMPOSITION:
The AC comprises three Board members and the Chairman of the AC is Chin Kwai Yoong who was appointed on 15 August 2012. The details of the AC membership are as follows:
• Chin Kwai Yoong
• Dato’ Mohamed Khadar Bin Merican
• Bernard Anthony Cragg
All members of the AC are non-executive directors, a majority of whom are independent directors and all members are chartered accountants.
1.5 ATTENDANCE OF MEETINGS:
There were four AC meetings held during the financial year ended 31 January 2013, which were attended by all AC members. The Vice President of Group Corporate Assurance (internal audit) (“CA”) and its selected Senior Management, the Group’s external auditors, CEO, CFO and certain heads of key business units also attended the meetings at the invitation of the AC. At the meetings, the external auditors, CA and heads of business units were invited to present their reports to the AC on, inter alia, financial, audit, technology and information systems and risk management areas. In respect of the financial results and matters which require the AC’s review prior to obtaining the Board’s approval, the AC Chairman will present the AC’s recommendations to the Board as well as highlight any issues within the AC’s Terms of Reference that the Chairman deems necessary. During the financial year, the AC met with the external auditors on two occasions and CA on three occasions, separately, without the presence of management. the AC members also individually met with the external auditors and CA, separately, on a number of occasions during the financial year.
The Chairman of the AC reports regularly to the Board on the activities of the AC. During the financial year ended 31 January 2013, the AC carried out the following activities:
1.6 Financial Reporting and Compliance:
- Reviewed the statutory financial statements, interim, quarterly financial reports and press releases relating to the quarterly financial reports and announcements of the Group for quality of disclosure and presentation and discussed significant issues to ensure that compliance with applicable approved accounting standards and legal requirements were met.
- Reviewed the external auditors’ report on the Group’s statutory financial statements and quarterly financial reports prior to making a recommendation to the Board for approval and public release thereof.
- Reviewed matters relating to the accounting, auditing, financial reporting practices and procedures of the Group.
1.7 Company Assets & Net Earnings:
Company total assets increased by 50% in the recent years, however the company net income decreased by 16% over the recent year 2012.
1.8 Chairman’s message:
We have achieved many outstanding milestones this year and reaffirmed our status as the leading integrated consumer media entertainment group in Malaysia.
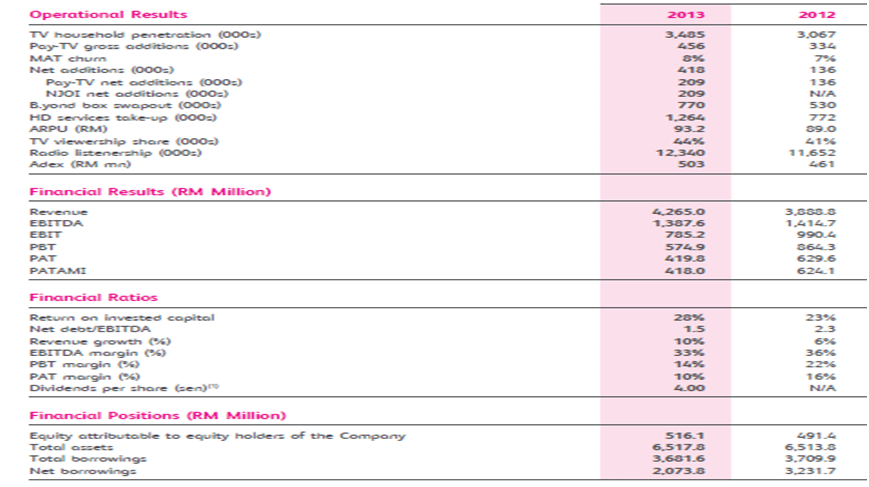
Strong Results & Dividends: Astro delivered a strong performance in 2012 where our total revenue grew 10% to RM4.3 billion. We achieved customer growth of 418,000, increasing our total customer base to 3.5 million and overall TV household penetration rate to 52%. Our ARPU increased to RM93.20, an uplift of over RM4 from 2011, underpinned by the high take-up of our value-added products and services. We also achieved 9% adex growth which surpassed the industry growth rate. We reiterated our commitment to deliver total returns to our shareholders when we started paying quarterly dividends in the third quarter of 2012, two quarters earlier than what was articulated during the IPO process. The Board of Directors is also pleased to recommend for shareholders’ approval at the forthcoming Annual General Meeting a final dividend of 1.0 sen per share in respect of the financial year ended 31 January 2013. This equals a healthy payout of 4 sen per share for owning Astro shares less than two quarters. With our strong growth momentum, high visibility on costs, particularly content cost coupled with our highly cash generative business, we are well positioned to adopt a progressive dividend policy going forward.
Successful IPO: A significant milestone in the history of the company was achieved on 19 October 2012 as we witnessed the successful completion of our IPO and the admission of our shares to the Official List of the Main Market of the Bursa Securities. The IPO received strong demand from the investing community, both locally and outside Malaysia. Our public portion under the retail offering was more than 6 times oversubscribed, and the institutional portion, excluding the MITI offering and cornerstone allocation, was over-subscribed by more than 30 times. The total proceeds from the IPO were approximately RM4.5 billion, of which the amount raised by Astro was approximately RM1.4 billion. Such an overwhelming response is a clear reflection of the investing community’s trust and confidence in our company, as well as in Malaysia as an attractive destination for investment. On behalf of Astro, I would like to express our sincere gratitude to all parties involved in particular, our shareholders, fellow members of the Board of Directors, the management and the employees of Astro.
Interpretation of Chairman’s Message:
Chairman message is quite apologetic because of the increases expenses incurred during the fiscal year of 2012, the company has decreased its net earnings in year 2012 by 16%, which significantly increased in the year 2011 as Astro recovered from the bad investment made by Astro in Indonesia. He want shareholders to be confident enough, by narrating the success stories of companies emphasizing more on the positive aspects for example company has increased its revenue despite having decreasing income. He wants shareholders to maintain their momentum on the company so it can prosper in future. However it doesn’t tells anything about future goal and objective which company wants to achieve strategically.
1.9 Summary of Operating Results:
Financial statement only displays the summary of the past two years about the increase in assets, revenue and other financial highlights as shown below.
1.10 Analyst Report On Astro:
Source: http://www.btimes.com.my/Current_News/BTIMES/articles/astro27/Article/
Analyst Name: Gou Thean Ou Published on 28 November, 2012
MOST of the analysts that started to initiate coverage on Astro Malaysia Holdings Bhd this week gave positive reviews on the pay-TV operator, with a potential upside on its share price of up to 38 per cent. The research houses that initiated the reports this week were previously in a so-called “blackout” phase as they were part of the investment banks which worked on the Astro initial public offering (IPO) exercise. Astro has a potential beneficiary of Malaysia’s attractive demographics: a young and growing population, whereby a growing economy is driving income growth. Malay households, which account for 60 per cent of Astro subscribers, have the highest income growth within the Malaysian population,” said Credit Suisse in its report yesterday. It has a “outperform” recommendation – using a mid-point 15 per cent discount to DCF (discounted cash flow) to arrive at a target price of RM3.50.
PART B: ANALYZING THE BALANCE SHEET (STATEMENT OF FINANCIAL POSITION) AND RATIOS
Question #01: For the most recent year, what are the top five asset accounts by size?
For the most recent year, top five assets includes following accounts from current and non-current assets for the year 2012 is
| Property, plant and equipment | 1,654,231 RM |
| Intangible assets | 1,770,735 RM |
| Deposits, cash and bank balances | 478,202 RM |
| Receivables and prepayments | 798,159 RM |
| Advances to immediate holding company | 1,500,000 RM |
Question #02: What percentage is each of total assets? (Vertical analysis: asset A / total assets)?
| Non-Current Assets | 2010 in RM*000 | Percentage % | 2011 in RM*000 | Percentage% | 2012 in RM*000 | Percentage% |
| Property Plant & Equipment | 1,397,643 | 34.9 | 1427499 | 43 | 1,654,231 | 25.3 |
| Investment In Associate | 39,429 | 0.6 | ||||
| Investment in Joint Venture | 8,678 | 0.1 | ||||
| Prepayment | 134,762 | 2 | ||||
| Advances to Immediate Holding Company | 1,500,000 | 23 | ||||
| Interest in Investment by using Equity method | 618,105 | 15.4 | ||||
| Investment in Subsidiaries | ||||||
| Deferred Tax assets | 5,899 | 0.1 | ||||
| Financial Assets | 20,000 | 0.5 | 10,000 | 0.3 | ||
| Film Library & Programed Rights | 239,656 | 6 | ||||
| Intangible Assets | 188,907 | 4.7 | 258,441 | 7.9 | 1,770,735 | 27 |
| 2,470,210 | 61.6 | 1,695,940 | 51.2 | 5,107,835 | 78 |
| Current Assets | 2010 in RM*000 | Percentage % | 2011 in RM*000 | Percentage% | 2012 in RM*000 | Percentage% |
| Inventories | 22,193 | 0.6 | 15363 | 0.4 | 13291 | 0.9 |
| Receivable and Pre Payments | 813,471 | 20.3 | 699086 | 21 | 798159 | 12.2 |
| Advances to former holding company | 257958 | 7.8 | ||||
| Advances to ultimate holding company | 105060 | 1.6 | ||||
| Financial Assets | ||||||
| Derivative Financial Instrument | ||||||
| Tax Recoverable | 2849 | 0 | 2723 | 0.08 | 1283 | 0.01 |
| Financial Assets | 15,000 | 0.4 | 10000 | 0.15 | ||
| Cash & Cash Equivalents | 683553 | 17 | 598336 | 18 | 478202 | 7.3 |
| 1,537,066 | 38.4 | 1573466 | 47.28 | 1,405,995 | 22.16 |
| Total Assets | 4,007,276 | 100 | 3,269,406 | 100 | 6,513,830 | 100 |
Question# 03: What are the major investing and financing activities (by dollar size) for the most recent year?
| Capital Expenditure | -163.5 | -372.1 | -386.1 |
| Sale Of Property, Plant, And Equipment | 0.5 | 1.2 | 0.1 |
| Cash Acquisitions | — | — | -314.2 |
| Sale (Purchase) Of Intangible Assets | -54.5 | -109.6 | -56.4 |
| Investments In Marketable & Equity Securities | -20.0 | 10.0 | — |
Question# 04: What does the debt-to-equity ratio measure in general? What do your results suggest about the company?
Answer: Debt ratio expresses the correlation between a company’s total debt and its assets. It illustrates whether the company has the ability to service its debt. It indicates what proportion of a company’s financing asset is from debt. It is calculated by dividing total liabilities into total assets.
Debit Ratio
| 2010 | 0.777675159 |
| 2011 | 0.647982845 |
| 2012 | 0.924553604 |
Debt ratio in the past three years have increased from 77% in 2010 to 92% in 2012, which means that ASTRO has acquired more then enough assets to service their debts when needed plus there is a slight decrease between the two years, which is a very good indication from financial perspective.
Equity ratio indicates what portion of the company’s assets that have been financed by equity. . It is calculated by dividing total equity into total assets.
EQUITY RATIO
| 2010 | 0.744 |
| 2011 | 1 |
| 2012 | 0.075 |
PART C: ANALYZING THE INCOME STATEMENT AND RATIOS
Question# 01 & 2: For the most recent year, what is/are the major revenue account(s)? Along with percentage%?
For the most recent year 2012, the major revenue contributing towards the revenue of ASTRO group is sale of film library and program rights. After the analysis of revenue section of income statement from the year 2011-2012 is increasing at the increasing rate of 10%, which is satisfactory, but not very good because the launch of HD Astro B.yond must have driven the sales to high level. The main source of revenue is subscription of Astro (Pay-Tv), which means that potential customers drive revenue for group, which includes domestic Malaysian household. Advertising is also another source of revenue for Astro where different companies of consumer goods advertise on this mass media to penetrate their brands in Malaysian market. The major portion of the revenue is shared by subscription of Astro Pay, the share of subscription is increasing at an increasing rate of 13% which is 2.7 million in 2012 fiscal year and whereas advertising revenue is second highest revenue generator portfolio for Astro, their advertising revenue is decreasing at the rate of 16%, which shrinks from 349K to 293K in fiscal year 2011 and 2012.
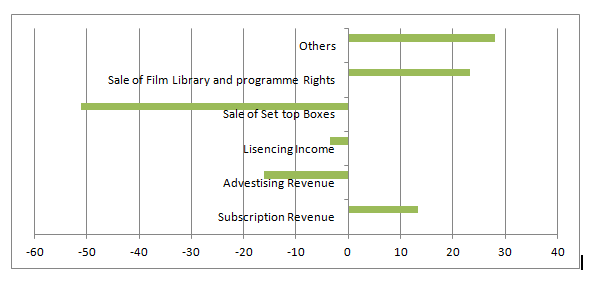
Question # 03: What percentage is each to total operating revenues? (Compute: revenue A / total revenues.)
The below figure shows the major revenue sources of Astro disclosed in their financial statements, 70% of Astro revenue comes from subscription business which is growing rapidly however second highest source of revenue is advertising revenue which is 7% of the total revenue earned by Astro
| Description | 2012 | Percentage |
| Subscription Revenue | 2700000 | 0.70190033 |
| Advertising Revenue | 293000 | 0.076169184 |
| TOTAL REVENUE | 3,846,700 |
Question #05: Ratio Analysis:
What do the total asset turnover and the return on assets ratios measure in general?
Asset turnover measures a firm’s efficiency at using its assets in generating sales or revenue the higher the number the better. It also indicates pricing strategy: companies with low profit margins tend to have high asset turnover, while those with high profit margins have low asset turnover. Return on assets (ROA) gauges how efficiently a company can squeeze profit from its assets, regardless of size. A high ROA is a telltale sign of solid financial and operational performance.
| RATIO ANALYSIS | 2010 | 2011 | 2012 |
| Net Income | 501.5 | 748.1 | 629.1 |
| TOTAL ASSETS | 2,798.60 | 3,269.40 | 6,513.80 |
| ROA RATIO | 0.179197 | 0.228819 | 0.09658 |
| 18% | 22.90% | 9.60% |
Astro Inc is making effective use of assets to generate income, however the financial and operation performance in the last year 2012 was not satisfactory as the return on asset ratio reduced from 22.9% to 9.6%. We can conclude that efficiency of the firm decreased in year 2012 because of the loss incurred by Astro in the Indonesia in the part few years.
| RATIO ANALYSIS | 2010 | 2011 | 2012 |
| Total Revenue | 2,966.00 | 3,378.30 | 3,846.70 |
| TOTAL ASSETS | 2,798.60 | 3,269.40 | 6,513.80 |
| Total Asset Turnover RATIO | 1.059816 | 1.033309 | 0.590546 |
Profit margin of Astro earned is quite minimal as firm is not making effective use of their assets to generate more revenue for the company. In the last year 2012, Astro has significantly improved their efficiency to earn more revenue as their asset turnover ratio decreased more than 50%
Question #06: Revenue Recognition Policy of Astro?
Dividend income of the Company is recognised when the right to receive payment is established. Subscription fees derived from satellite television services are recognised as earned over the period the services are provided. Subscription fees received prior to services being provided are recognised as unearned revenue. Airtime revenues, derived from the placement of commercials on television and broadcast of commercials on radio stations, are recognised in the period during which the commercials are aired, net of service taxes and discounts. Advertising revenues from sale of advertising space in magazines are recognised in the period during which advertisings are published, net of service taxes and discounts. Certain advertising revenues are generated in barter transactions in exchange for equipment, goods or services, provided by the advertisers. Such revenues are recorded at the estimated fair market value of the equipment and goods received. The revenue is recognised over the period of the contracts as the commercials are aired. The fair market value of the equipment and goods received is recorded as an asset when they qualify for assets recognition or otherwise expensed. Services received in exchange are expensed over the service period. Revenue from sale of set-top boxes for non-subscription services is recognised in the period it is delivered as ownership is transferred to the customer upon delivery. HD set top boxes are not sold as ownership of these boxes remain with the Group. Fees from the development of multimedia and interactive applications (interactive services) are recognized over the contractual period in which the development takes place. Fees from the right to access multimedia and interactive applications are recognised over the period in which the services are provided. Interest income is recognised using the effective interest method. (Annual Report, 2013)
Question# 07: What are the net earnings or net income? Did the net earnings/income (or net loss) increase or decrease from the prior year, and by how much?
Net Earnings / Net Income:
| NET EARNING | 2010 | 2011 | 2012 |
| NET INCOME TO COMMON EXCLUDING EXTRA ITEMS | 501.5 | 748.1 | 629.1 |
The above figure shows the net Income, collected from the income statement of the annual report. The above below show increasing trend from 2010-2011 and decreasing trend from year 2011-2012. In 2011 net earnings of Astro increased by 246.6 million RM, hence in the following year decreased by 119 million RM.
Question# 08: Did earnings (loss) from operations increase or decrease from the prior year?
| NET EARNING | 2010 | 2011 | 2012 |
| OPERATING INCOME | 678.9 | 981.1 | 988.4 |
Operating income from 2010 to 2011 increased by 44%, which means that company has enhanced their revenue and minimized their expenses, whereas in the following year increase in the operating income is by 7% from 981 million Rm to 988.4 Rm.
Non-Operating Earning and Loss
| NET EARNING | 2010 | 2011 | 2012 |
| Interest Expense | -68.4 | -74.7 | -149.9 |
| Interest And Investment Income | 12.5 | 16 | 65.5 |
| Other Non-Operating Expenses, Total | 52.6 | 83.3 | -34.5 |
| Other Non-Operating Income (Expenses) | -0.4 | -9.7 | -31.3 |
| Gain (Loss) On Sale Of Assets | 0.5 | 2.1 | — |
Above figure shows the non-operating income and expenses for the following three years selected. Non operating expenses have increased from 2010 to 2011 over 58%, with the sharp decrease in the year 2012. Net operating income is decreasing which means company has incurred a loss which is decreasing every year as shown in figure above. The above table shows that there was no disposal of assets in the last year 2012 however there was a sharp gain on assets in the year 2010 and 2012.
Question# 09 Financial Ratios
The portion of a company’s profit allocated to each outstanding share of common stock. Earnings per share serves as an indicator of a company’s profitability. The EPS ratio shows 121% of, which means that company allocates a lot of money to each outstanding common stock.
| In Million RM | |
| Net Income | 629.1 |
| Preferred Dividends | 0 |
| Average Outstanding (Cash flow) | 5.2 |
| EARNING PER SHARE RATIO | 120.98077 |
Net Profit Margin and Return on Equity
A ratio of profitability calculated as net income divided by revenues, or net profits divided by sales. It measures how much out of every dollar of sales a company actually keeps in earnings. Following figure shows the NPV ratio of Astro for the past three years.
| PROFITABILITY RATIO | 2010 | 2011 | 2012 |
| NET INCOME | 501.5 | 748.1 | 629.1 |
| TOTAL REVENUES | 2,966.00 | 3,378.30 | 3,846.70 |
| Net Profit margin Ratio | 0.169083 | 0.2214427 | 0.163543 |
The NPV ratio shows that Astro has better control over their cost, Astro NPV ratio increased from 16% to 22% in year 2010 to 2011, however following decreasing trend coming back to 16%, which means that in the year 2012, Astro earned 0.16 cents on each dollar spent by them.
Return on equity is the amount of net income returned as a percentage of shareholders equity. Return on equity measures a corporation’s profitability by revealing how much profit a company generates with the money shareholders have invested. The below table shows equity ratio for the following three years
| EQUITY RATIO | 2010 | 2011 | 2012 |
| NET INCOME | 501.5 | 748.1 | 629.1 |
| TOTAL EQUITY | 809.8 | 1,150.90 | 491.4 |
| Net Profit margin Ratio | 0.619289 | 0.650013 | 1.28022 |
The ratio value reveals that Astro Inc has high values of equity ratio with 60% in 2010, 65% in 2011 and 102% in the year 2012. Shareholders of Astro feel confident because company is generating a handsome profit from the shareholders equity. Higher is the return on equity, higher is the confidence of shareholders in the company.
[ Acquire Top-notch Financial Statement Analysis Assignment Help From Expert’s & Boost Your Grades Up ]
PART D: ANALYZING THE STATEMENT OF CASH FLOWS
| Account Description | Current Year | Prior Year |
| Net cash flows from operations | 1287.1 Million RM | 1038.5 Million RM |
| Net cash flows from investing | -467.4 Million RM | -2,203.1 Million RM |
| Net cash flows from financing | -481.8Million RM | 1044.9 Million RM |
| Net increase (decrease) in cash flows | 337.8 million RM | -120.1 Million RM |
| Cash balance at beginning of year | 260.6 million RM | 598.3 million RM |
| Cash balance at end of year | 598.3 million RM | 478.2 Million RM |
| Does the total match the Cash amount reported on the Balance Sheet? | Yes | Yes |
| Reconciliation of Cash balance at end of year to Cash on Balance Sheet | 598.3 Million RM | 478.2 Million RM |
| Account Description | Current Year | Prior Year |
| Net sales | 3,378.3 Million RM | 3,846.7 Million RM |
| Net earnings | 748.1 Million RM | 629.1 Million RM |
| Net operating cash flows | 1287.1 Million RM | 1038.5 Million RM |
Ratio Analysis: What is the quality of earnings ratio for the most current year?
A quality of earnings ratio helps determine how a company has earned reported high earnings and whether income reported is legitimate or creative accounting methods have helped to determine this number.
| EARNING RATIO | 2012 |
| Net Income | 629.1 |
| Cash From Operations | 1,038.50 |
| Earnings Ratio | 0.605778 |
The main reasons for differences between operating cash flow and operating profit are that operating profit is the difference between revenues earned and expenses charged whereas operating cash flow is the difference between revenues received and expenses paid.
Question# 03: Cash Flows from Investing Activities
| Description of Activity | Current Year | Prior Year |
| Cash outflows 1: Capital Expenditure Cash outflows 1: Cash Acquisition Cash Outflow 3: Dividend Paid | -386.1 -314.2 -1,045.8 | -372.1 —- -405.9 |
| Cash inflows1 : Other Operating Activities Cash inflows1 Long Term debt Issued | 185.5 3,004.6 | 18.8 —- |
From the analysis of 2 years data stated in the above table Astro is not engaged in selling of assets, however company has sold some assets of 0.1 million Rm in the year 2012. Balance sheet reveals that there is no significant increase in the current assets however in year 2012 company has significantly increases their non-current assets by investing in property, plant and equipment. Astro has made some long term investment which might not have short term impact on the bottom line of following year. Interest costs on borrowings to finance the construction of property, plant and equipment are capitalised as part of the cost the asset during the period of time that is required to complete and prepare the asset for its intended use. Other borrowing costs are expensed off.
Ratio Analysis
Capital Acquisition Ratio
The capital acquisition ratio reflects the company’s ability finance capital expenditures from internal sources.
| CASH FROM OPERATIONS | 521.2 | 1,287.10 | 1,038.50 |
| Common Dividends Paid | -145.5 | -405.9 | -1,045.80 |
| Cash Acquisition | —— | -314.2 | |
| Ratio | -7.30 |
Dividends have been deducted from cash flow from operating activities and then divided by acquisition. Financial statement have no record for the cash paid for the acquisition for the year 2010 and 2011, however year have capital acquisition ratio of 2.3%, which states that capital acquisition are not draining more cash for acquisition, generally a good sign for company. Company is not financing any capital acquisition in 2010 and 2011, however company has made capital acquisition of 314.2 Million RM.
Question# 04: Cash Flows from Financing Activities?
| Description of Activity | Current Year | Prior Year |
| Cash outflows: | -481.8 | |
| Cash inflows: | 1,044.9 |
In the previous year 2011, company has been relying high on equity however in year 2012, company is relying more on debt taken from its other subsidiaries and financial institution such as May Bank Sdn Berhad. Company is paying a large chunk of interest as stated in their income statement in year 2012 interest expense has increased. Astro has taken a long term debt paying off interest and principle amount. Company has reduced its reliance on equity by 49% as shown in the income statement vertical analysis.
PART E: ANALYZING CASH, RECEIVABLES, AND PREPAIDS
Question# 01: Cash: In the balance sheet company has reported the cash equivalent instead of cash in the current asset as shown in table below.
| Cash And Equivalents | 260.6 | 598.3 | 478.2 |
Note # 25 of Cash & Equivalents
Investment in unit trust cash/money markets made by the Group can be purchased or liquidated with one day’s notice. Deposits of the Group and Company have an average maturity of 145 days and 152 days respectively (31.1.2012: 21 days; 1.2.2011: 59 days). The effective interest rates per annum on deposits for the Group and Company range from 2.2% to 3.4% (31.1.2012: 2.2% to 3.6%; 1.2.2011: 2.0% to 3.6%). Cash and bank balances include an amount of RM49,172,000 (31.1.2012: RM9,494,000; 1.2.2011: RM Nil) under an auto-placement arrangement for collections which earned overnight interest of 3.0% (31.1.2012: 1.3%; 1.2.2011: RM Nil) per annum.
Question #02: Receivables
Percentage of the assets have been stated in the Part B (vertical analysis)
Receivable note
Included in the other receivables, amounts due from related companies and amounts due from related parties of the Group and Company is an impairment of RM19,098,000 (31.1.2012: RM7,889,000; 1.2.2011: RM7,384,000), RM Nil (31.1.2012: RM Nil; 1.2.2011: RM54,924,000) and RM4,511,000 (31.1.2012: RM4,201,000; 1.2.2011: RM3,968,000) respectively. The impairment amount recognised in the current financial year was RM11,209,000 (31.1.2012: RM505,000; 1.2.2011: RM1,217,000) and RM310,000 (31.1.2012: RM233,000; 1.2.2011: RM188,000) for other receivables and amounts due from related parties respectively. The amounts due from ultimate and immediate holding companies, related companies, related parties and subsidiaries are unsecured, non-interest bearing and have no fixed terms of repayment. Interest from subsidiaries are based on the terms
Ratio Analysis
An accounting measure used to quantify a firm’s effectiveness in extending credit as well as collecting debts. The receivables turnover ratio is an activity ratio, measuring how efficiently a firm uses its assets.
This ratio shows that how many times a company’s inventory is sold and replaced over a period. The days in the period can then be divided by the inventory turnover formula to calculate the days it takes to sell the inventory on hand or “inventory turnover days.
| Description | 2010 | 2011 | 2012 |
| Sales | 2,966.00 | 3,378.30 | 3,846.70 |
| Inventory | 21.3 | 15.4 | 13.3 |
| Inventory Turnover Ratio | 139.2488 | 219.3701 | 289.2256 |
Despite having high inventory turnover ratio, we will not suggest anything to the company because company doesn’t generates more revenue from selling inventory which includes only set top boxes, tapes and other materials which are prerequisite for the subscription of Astro.
Account Receivable Note
To ascertain that proper action had been taken in relation to the writing off of bad debts and the making of allowance for doubtful debts and satisfied themselves that all known bad debts had been written off and that adequate allowance had been made for doubtful debts; and to ensure that any current assets, other than debts, which were unlikely to realize in the ordinary course of business their values as shown in the accounting records of the Group and Company had been written down to an amount which they might be expected so to realize. Astro has write off bad debts from the statement of cash flows for the year 2012 which 5.37 million RM. Included in the other receivables, amounts due from related companies and amounts due from related parties of the Group and Company is an impairment of RM19,098,000 (31.1.2012: RM7,889,000; 1.2.2011: RM7,384,000), RM Nil (31.1.2012: RM Nil; 1.2.2011: RM54,924,000) and RM4,511,000 (31.1.2012: RM4,201,000; 1.2.2011: RM3,968,000) respectively. The impairment amount recognised in the current financial year was RM11,209,000 (31.1.2012: RM505,000; 1.2.2011: RM1,217,000) and RM310,000 (31.1.2012: RM233,000; 1.2.2011: RM188,000) for other receivables and amounts due from related parties respectively. The amounts due from ultimate and immediate holding companies, related companies, related parties and subsidiaries are unsecured, non-interest bearing and have no fixed terms of repayment. However financial statements do not disclose any other information on account receivables in their notes section.
Question # 03: What are the company’s prepaid expenses in dollars/other currency at the end of each year?
Following table shows the description of prepaid expenses occurred by the company in the following three years. In year 2010, prepaid expenses were 3.8% of the total assets. In year 2011, it reduced to 3.4% however in year 2012, company incurred prepaid expenses of 1.9% of the total assets. We can conclude that company is minimizing their prepaid expenses.
| Description | 2010 | 2011 | 2012 |
| Prepaid Expenses | 106.7 | 111.5 | 126.9 |
| Total Assets | 2,798.60 | 3,269.40 | 6,513.80 |
| Percentage of Total Assets | 0.038126 | 0.034104 | 0.019482 |
On 19 November 2012, the Company prepaid a sum of RM510,000,000 of its Ringgit term loan facilities of RM2,010,000,000 which was part of a syndicated loan obtained in prior financial year. Following the prepayment, the Company has also unwound the interest rate swap facility of RM510,000,000 with a mark-to-market loss of RM1,790,000.
PART F: ANALYZING INVENTORIES
Question# 01: What percentage is this asset of total assets for each of the last three years?
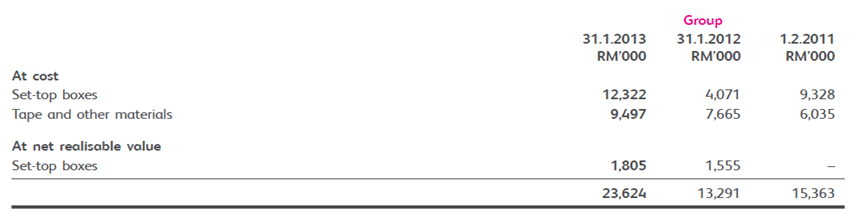
The below figures shows the amount of inventory stated on the balance sheet for the following three years. Since Astro is a service provider, it doesn’t rely more on inventories as it only provides sales of top up boxes, which is just a small chunk of its revenue. In year 2010 inventory was 0.7% of the total assets whereas in the following year in 2011 is 0.4% and 2012 was 0.2% as shown in table below.
| Description | 2010 | 2011 | 2012 |
| Inventory | 21.3 | 15.4 | 13.3 |
| Total Assets | 2,798.60 | 3,269.40 | 6,513.80 |
| Percentage of Total Assets | 0.007611 | 0.00471 | 0.002042 |
Inventories which principally comprise tapes, set-top boxes used in the provision of non-subscription services and other materials are stated at the lower of cost and net realizable value. Cost is determined based on the weighted average cost method. Where appropriate, allowance is made for obsolete or slow moving inventories based on management’s analysis of inventory levels and future sales forecasts. Net realizable value reflects the value to the business of the set-top boxes in the hands of the customer.
The financial statement doesn’t disclose the inventory valuation method, as it doesn’t have any inventory note accept the table above.
Question# 02: Ratio Analysis
This ratio shows that how many times a company’s inventory is sold and replaced over a period. The days in the period can then be divided by the inventory turnover formula to calculate the days it takes to sell the inventory on hand or “inventory turnover days.
| Description | 2010 | 2011 | 2012 |
| Sales | 2,966.00 | 3,378.30 | 3,846.70 |
| Inventory | 21.3 | 15.4 | 13.3 |
| Inventory Turnover Ratio | 139.2488 | 219.3701 | 289.2256 |
Despite having high inventory turnover ratio, we will not suggest anything to the company because company doesn’t generates more revenue from selling inventory which includes only set top boxes, tapes and other materials which are prerequisite for the subscription of Astro.
PART G: ANALYZING CAPITAL ASSETS
Question# 01: List the accounts and amounts of the company’s capital assets (land, building, equipment, intangible assets, natural resources, and others). This will be in the Notes.
| Freehold Land | Building | Satellite Transponders | Equipment Fixtures | Broad cast and Transmission Equipment | Asset Under Construction |
| 10,586 | 107,608 | 695,021 | 111,078 | 676,913 | 53,025 |
The above table shows the value of each capital asset possessed by the company in the year 2012 with the net present value where depreciation is deducted. The below table shows the percentage of each capital assets contributing to the total assets, freehold land is 0.16% of the total assets, building is 10%, equipment fixture is 1.7%, broadcasting transmission is 10% and 0.8% of assets are under construction.
| Description | Freehold Land | Building | Satellite Transponders | Equipment Fixtures | Broad cast and Transmission Equipment | Asset Under Construction |
| Capital Assets | 10,586 | 107,608 | 695,021 | 111,078 | 676,913 | 53,025 |
| Percentage | 0.001625158 | 0.01652 | 0.106699284 | 0.01705264 | 0.103919353 | 0.008140372 |
There is no disclosed note attached in the financial statement however company uses depression method to find the book value of the assets. Company is investing in a long term assets, as there is a budget allocated every year 2010, 2011 and 2012 for the new under construction asset.
Question# 02: Ratio Analysis
The fixed-asset turnover ratio measures a company’s ability to generate net sales from fixed-asset investments – specifically property, plant and equipment (PP&E) – net of depreciation. A higher fixed-asset turnover ratio shows that the company has been more effective in using the investment in fixed assets to generate revenues.
| 2010 | 2011 | 2012 | |
| Net Sales | 259.8 | 321.4 | 389.3 |
| NET PROPERTY PLANT AND EQUIPMENT | 1,330.40 | 1,427.50 | 1,654.20 |
| Fixed Asset turnover Ratio | 0.19528 | 0.225149 | 0.23534 |
Fixed asset turnover ratio is increasing with 19.5% in 2010, 22.5% in 2011 and 23% in 2012 which means that Astro has been more effective in using the investment in fixed assets to generate revenues. We will suggest Astro to continuously enhance their assets every years by investing in the future assets.
PART H: ANALYZING SHAREHOLDERS’ EQUITY
Question# 01: List the accounts and amounts of the company’s shareholders’ equity?
| Description of Equity Section | 2010 | 2011 | 2012 |
| TOTAL PREFERRED EQUITY | 0 | 0 | 0 |
| Common Stock | 0.1 | 0.1 | 0.1 |
| Additional Paid in Capital | 6,798.10 | 6,798.10 | 6,798.10 |
| Retained Earnings | -636.8 | -294.6 | -730.2 |
| Comprehensive Income and Other | 5,351.60 | 5,352.80 | -5,585.10 |
| TOTAL COMMON EQUITY | 809.8 | 1,150.90 | 482.9 |
| TOTAL EQUITY | 809.8 | 1,150.90 | 491.4 |
Equity Note:
The salient terms relating to the issuance of RPS of the Company are disclosed in Note 31 to the financial statements. As part of AHSB Group Reorganization, the Company recapitalized its debts owing to AHSB to offset an amount of RM6,798,235,328 arising from the Company’s acquisition of the entire issued and paid-up share capital of MBNS, ASSB, AGS and MMTSB. The recapitalization exercise entailed subscription by ANM of 98,235 ordinary shares of RM1.00 each issued at RM1,000 per share, 1 ordinary share of RM1.00 issued at RM328 and 6,700 redeemable preference shares of RM0.10 each issued at RM1,000,000 per RPS in the Company (Note 31), consequently resulting in creation of a share premium account of RM6,798,136,422. During the financial year, the Company had undertaken a pre-IPO restructuring which comprised the following: Redeemed 1,500 and 5,200 Redeemable Preference Shares (“RPS”) of RM0.10 each at a redemption price of RM1,000,000 per RPS for a total amount of RM1,500,000,000 and RM5,200,000,000 on 30 April 2012 and 19 September 2012 respectively; Sub-divided the authorized share capital of the Company of RM100,000 divided into 100,000 ordinary shares of RM1.00 each into 1,000,000 ordinary shares of RM0.10 each, and each new ordinary share of RM0.10 nominal value shall have the same rights as the existing ordinary shares of RM1.00 each; Sub-divided the entire issued and paid-up ordinary share capital comprising 98,238 fully paid ordinary shares of RM1.00 each into 982,380 new ordinary shares of RM0.10 each and such new shares be issued to the immediate holding company, Astro Networks (Malaysia) Sdn. Bhd. (“ANM”), on the basis of 10 new ordinary shares of RM0.10 each for every existing 1 ordinary share of RM1.00 each; Increased the authorized share capital of the Company from RM100,000 comprising 100,000 ordinary shares of RM1.00 each to RM1,000,000,000 comprising 10,000,000,000 ordinary shares of RM0.10 each, by the creation of 9,999,000,000 new ordinary shares of RM0.10 each to rank pari-passu in all respects with the existing ordinary shares of the Company; Allotted and issued 4,722,017,620 new ordinary shares with a par value of RM0.10 each to ANM for a total subscription price of RM5,200,000,000 or approximately RM1.10 per new ordinary share. On 11 October 2012, the Company offered Share Awards in respect of a total number of 21,927,000 new ordinary shares of RM0.10 each under the Management Share Scheme to the eligible executives and eligible employees of the Group. On 19 October 2012, the entire issued and paid-up share capital of the Company was listed on the Main Market of Bursa Malaysia Securities Berhad, comprising an offer for sale of 1,044,000,000 ordinary shares of RM0.10 each by ANM and public issue of 474,300,000 new ordinary shares of RM0.10 each. On 19 November 2012, the Company issued and allotted 1,000,000 ordinary shares of RM0.10 in the Company to a Director, Dato’ Rohana Binti Tan Sri Datuk Haji Rozhan (“RR”), pursuant to a letter of offer dated 11 October 2012 (“Offer Letter”) for the grant of 3,200,000 ordinary shares of RM0.10 each in the Company to RR pursuant to the terms of the Offer Letter and in accordance with the By-laws of the Management Share Scheme of the Company.
PART I: FINANCIAL ANALYSIS OF THE FINANCIAL STATEMENTS
Question# 01: Horizontal Analysis of Balance Sheet
Following table shows the horizontal trend analysis of two years Balance sheet of Astro for the year 2011 and 2012.
| Non-Current Assets | 2011 in RM*000 | 2012 in RM*000 | Increase or Decrease | PERCENTAGE % |
| Property Plant & Equipment | 1427499 | 1,654,231 | 226,732 | 0.137061873 |
| Investment In Associate | 39,429 | 39,429 | ||
| Investment in Joint Venture | 8,678 | 8,678 | ||
| Prepayment | 134,762 | 134,762 | ||
| Advances to Immediate Holding Company | 1,500,000 | 1,500,000 | ||
| Interest in Investment by using Equity method | 0 | |||
| Investment in Subsidiaries | 0 | |||
| Deferred Tax assets | 0 | |||
| Financial Assets | 10,000 | -10,000 | ||
| Film Library & Programed Rights | 0 | |||
| Intangible Assets | 258,441 | 1,770,735 | 1,512,294 | 0.854048742 |
| TOTAL NON CURRENT ASSETS | 1,695,940 | 5,107,835 | 3,411,895 | 0.66797283 |
| Current Assets | 2011 in RM*000 | 2012 in RM*000 | Increase or Decrease | PERCENTAGE % |
| Inventories | 15363 | 13291 | -2072 | -0.155894967 |
| Receivable and Pre Payments | 699086 | 798159 | 99073 | 0.124126897 |
| Advances to former holding company | 257958 | -257958 | ||
| Advances to ultimate holding company | 105060 | 105060 | ||
| Financial Assets | 0 | |||
| Derivative Financial Instrument | 0 | |||
| Tax Recoverable | 2723 | 1283 | -1440 | -1.122369447 |
| Financial Assets | 10000 | 10000 | ||
| Cash & Cash Equivalents | 598336 | 478202 | -120134 | -0.251220196 |
| TOTAL CURRENT ASSETS | 1,573,466 | 1,405,995 | -167,471 | -0.119112088 |
| TOTAL ASSETS | 3,269,406 | 6,513,830 | 3,244,424 | 0.498082388 |
| Current Liabilities | 2011 in RM*000 | 2012 in RM*000 | Increase or Decrease | PERCENTAGE % |
| Accounts Payables | 1013882 | 1,580,660 | 566,778 | |
| Advances from ultimate holding | 66200 | 66,200 | ||
| Derivative Financial Instrument | 1154 | 3,627 | 2,473 | 0.681830714 |
| Borrowings | 32444 | 43,484 | 11,040 | 0.253886487 |
| Current Tax Liabilities | 82,914 | 82,914 | ||
| Total Current Liabilities | 1,047,480 | 1,776,885 | 729,405 | 0.410496459 |
| Equity | 2011 in RM*000 | 2012 in RM*000 | Increase or Decrease | PERCENTAGE % |
| Share Capital | 98 | 98 | 0 | |
| Share Premium | 6,798,136 | 6,798,136 | 0 | |
| Capital Redemption Reserve | 5,351,615 | 5,470,197 | 118,582 | 0.02167783 |
| Merger Reserve | 0 | |||
| Exchange Reserve | 0 | |||
| Capital Reorganization Reserve | 1,154 | 114,916 | 113,762 | 0.989957882 |
| Hedging Reserve | 0 | |||
| Other Reserve | 0 | |||
| Accumulated Losses/ R.E | 294,579 | 730,204 | 435,625 | 0.59657986 |
| Non Controlling Interests | 8,554 | 8,554 | ||
| Minority Interest | 0 | |||
| Total Equity | 1,150,887 | 491,445 | -659,442 | -1.341842933 |
Question# 02: Vertical Analysis of Income Statement
| INCOME STATEMENT | 2010 | Percentage % | 2011 | Percentage % | 2012 | Percentage % |
| Revenues | 2,966.00 | 3,378.30 | 3,846.70 | |||
| TOTAL REVENUES | 2,966.00 | 3,378.30 | 3,846.70 | |||
| Cost of Goods Sold | 1,802.10 | 0.61 | 1,908.40 | 0.56 | 2,212.70 | 0.575220319 |
| GROSS PROFIT | 1,164.00 | 1,469.90 | 0.44 | 1,634.00 | 0.424779681 | |
| Selling General & Admin Expenses, Total | 506.9 | 0.170903574 | 514 | 0.15214753 | 672.2 | 0.411383109 |
| Other Operating Expenses | -21.8 | -25.2 | -26.6 | |||
| OTHER OPERATING | 485.1 | 0.163553608 | 488.8 | 0.144688157 | 645.6 | 0.167832168 |
| EXPENSES, TOTAL | ||||||
| OPERATING INCOME | 678.9 | 0.228894134 | 981.1 | 0.290412338 | 988.4 | 0.256947513 |
| Interest Expense | -68.4 | -74.7 | -149.9 | |||
| Interest and Investment Income | 12.5 | 0.00421443 | 16 | 0.00473611 | 65.5 | 0.017027582 |
| NET INTEREST EXPENSE | -55.8 | -58.7 | -84.5 | |||
| Income (Loss) on Equity Investments | — | — | 4.2 | 0.001091845 | ||
| Currency Exchange Gains (Loss) | 53 | 0.017869184 | 93 | 0.027528639 | -7.4 | |
| Other Non-Operating Income (Expenses) | -0.4 | -9.7 | -31.3 | |||
| EBT, EXCLUDING UNUSUAL ITEMS | 675.6 | 0.227781524 | 1,005.70 | 0.30 | 869.4 | 0.226011906 |
| Gain (Loss) on Sale of Assets | 0.5 | 2.1 | — | |||
| EBT, INCLUDING UNUSUAL ITEMS | 676.1 | 0.227950101 | 1,007.80 | 0.30 | 869.4 | 0.226011906 |
| Income Tax Expense | 174.5 | 0.058833446 | 259.6 | 0.076843383 | 235.2 | 0.061143318 |
| Minority Interest in Earnings | — | — | -5.1 | |||
| Earnings from Continuing Operations | 501.5 | 0.16908294 | 748.1 | 0.221442737 | 634.2 | 0.164868589 |
| NET INCOME | 501.5 | 0.16908294 | 748.1 | 0.221442737 | 629.1 | 0.163542777 |
Question# 03: Ratio Analysis
Working capital is a financial metric which represents operating liquidity available to a business. In case of Astro, it had good working capital in the year 2011, but in the year 2012 Astro was facing working capital deficiency, it happens If current assets are less than current liabilities. The year 2011 was good as company can pay its short term debtors money using their current assets however in the year 2012, company has enhanced its liability a lot by talking a lot of debt resulting in negative cash value. The below table shows the working capital
| Liquidity Ratio | 2011 | 2012 |
| Current Assets | 1,573,466 | 1,405,995 |
| Current Liabilities | 1,047,480 | 1,776,885 |
| 525,986 | -370,890 |
Positive working capital is required to ensure that a firm is able to continue its operations and that it has sufficient funds to satisfy both maturing short-term debt and upcoming operational expenses.
When it comes to long term debt company is not been capable of paying long term debt using their equity. In year 2012 Astro is relying more on debt instead of equity.
| Liquidity Ratio | 2011 | 2012 |
| Total Debt | 2,118,519 | 6,022,385 |
| Total Equity | 1,150,887 | 491,445 |
| 967,632 | 5,530,940 |
[ Get Superior Financial Statement Analysis Assignment Help From Expert Writers ]
RECOMMENDATIONS:
1) Astro needs to exploit different segments because they focus has always been Malay ethnic race, they needs to focus other ethnic groups in Malaysia and provide 24/7 Entertainment to Indians and Chinese minority in Malaysia.
2) Astro needs to upgrade their distribution network, because their customers are not satisfied with their services, thus they should focus on wireless technology and upgrade technologies of their potential customers who are already using Astro in order to avoid problems of connectivity and bad signals especially in rainy seasons.
3) Astro should work closely with law enforcement agencies to eliminate illegal television market in Malaysia to expand their distribution network domestically.
4) ASTRO should be more aware of their competitors. Even though they are small and yet in the beginning stage, they may pose a threat eventually, and ASTRO would be well prepared if they take advance notice of it.
5) ASTRO should be more technologically adept since its competitors are from the IT related field, and they are in a highly technologically innovative industry, so it would be advisable for ASTRO to spend more on R&D.
6) Also, it is advisable for ASTRO to venture into new fields and other related industries so that they can enjoy economies of scale, and further expand their company.
7) Astro needs to create a balance reliance on equity and debt both as in year 2012 Astro has increased its reliance on borrowings.
8) Astro needs to reduce their expenses and cost of good solds resulting in the decreasing trend of net income.
CONCLUSION:
Financial statement of Astro has been analyzed using three years comparison as a base, we have analyzed the company Annual report for the year 2010, 2011 and 2012. Different financial analysis tools such as vertical, horizontal and ratio analysis have been used to understand the financial structure of company from shareholders perspective. We have analyzed Astro three years balance sheet, income statement and cost of goods sold statement using framework of ISU provided by the lecturer. In the year 2012 company has marginally increased their current assets by 49% and non-current assets by 41% in the balance sheet assets section depicting the confidence of debtors to lend money to Astro for both short term and long term for investments. There is also a sharp increase in the current and non-current liability side depicting their high reliance on debt, however reliance on equity is reduced marginally because of the change in financial structure. Ratio analysis for assets depicts positive results balance the debtors concerns for liquidity. Income statement also depicts positive results of increase in revenue however expenses have increased marginally as Astro has invested a lot in 2012 in the construction of new assets. The net-earning of 2012 has decreased from the base years, however ratio analysis depicts positive indicators because of the significant improvement in assets. In the end recommendations have been given to Astro to overcome the negative aspects of the analysis.
REFFERENCES:
Astro All Asia Networks (AAAN 2004).” What’s so special about it? The first foreign incorporated company to list on the Kuala Lumpur Stock Exchange “ International Financial Law Review,March Supplement, Vol. 23
About Astro. (2012). Retrieved April 2, 2012 from http://www.astro.com.my/portal/
about-astro
ASTRO Annual report 2013; All Asia Telecommunication and Radio Operators.
Retrieved from, www.astro.com.my
Bernama (2008), ASTRO TO KEEP EXPANDING MALAYSIA’S OPERATIONS: MALAYSIAN NATIONAL NEWS AGENCY; The financial times Ltd. General Interest Periodicals-Malaysia.
Burton, J (2003), Malaysia’s Astro raises MDollars 2bn from IPO PAY TELEVISION; The Financial times, Issue 29.
Consumers Association. (2011). Astro’s monopoly has Short-changed Malaysian ; TV Viewers. Retrieved April 2, 2012 from http://www.consumer.org.my/index.php/development/private-sector/479-astros-monopoly-has-short-changed-malaysian-tv-viewers
Chen, S. J (2003) Malaysia’s Astro presses for IPO, The Deal.com, Issue 1.
Hamel E, Prahalad CK. (1994). Competing for the Future. Harvard Business School Press:
Boston, MA.
IFL, (2003); Astro leads way for foreign companies to float in Malaysia. International Financial Law Review, 02626969, Nov2003, Vol. 22, Issue 11
Johnson, M (2003); ASTRO HITS THE STARS WITH IPO. Asia Money, Volume 14. Issue 9. Pgs. 5
Rahim, S.A & Pawanteh, L (2011), Democratization of Information in Malaysia: A Response to Globalization, Asian Social Science, Issue 7, Volume 2. Pgs 3-11
Suruhanjaya Komunikasi dan Multimedia Malaysia SKMM, (2012). MEDIA REGULATORS MALAYSIA. MCMC, http://www.skmm.gov.my/index.php?c=public&v=art_view&art_id=30
")